In recent years, with the development of metro wireless infrastructure networks, the coverage of hotspots (APs) has increased significantly. Due to the increasing demand for location services and the expansion of WiFi applications, WiFi positioning has become an effective positioning method. GPS satellite positioning is the most important positioning method. It needs to obtain more accurate positioning in relatively empty and high-rise buildings. When people are indoors or in high-rise urban areas, the positioning accuracy is significantly reduced or even unable to locate. At this point, using the ubiquitous WiFi network will be able to compensate for the lack of GPS positioning. At present, most of the WiFi wireless positioning algorithms are mainly based on the arrival time, the angle of arrival, the model of the arrival time difference, and the position fingerprinting algorithm based on the received signal strength (RSSI). The wireless positioning method of the location fingerprint algorithm does not require a known AP. The location information and accurate channel model, the algorithm has greater advantages in positioning performance and availability. Therefore, this paper firstly designs the overall system framework, analyzes the current problems of the algorithm, proposes an improved scheme, and implements a complete positioning system on the Android platform.
1 system overall design
The design goal of the system is to implement a real-time WiFi positioning system on an Android smart terminal, which includes a client, a data server, and a positioning server. In order to make the positioning process and the server communication process relatively independent, the AP hotspots dedicated to the positioning and the communication AP hotspots between the client and the server are respectively set, which can effectively reduce the initial cost of the system environment. The system framework of this solution is shown in Figure 1. The communication AP hotspot needs to be connected to the local area network to ensure that the WiFi signal in the location area is good, and the timeliness of data transmission and processing is ensured. The client and server implement reliable transmission over a TCP connection.
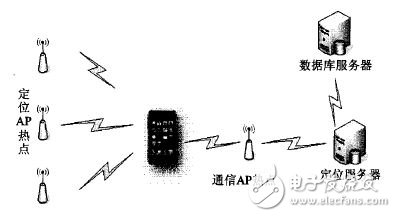
Figure 1 system frame diagram
2 system implementation
2.1 client module design
The system adopts a client/server (c/s) network architecture, and the client positioning process mainly includes WiFi wireless signal scanning, data transmission, interface display, etc. The flow chart of the process is shown in FIG. 2 .
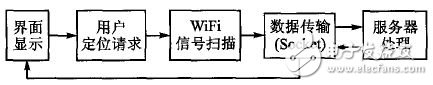
Figure 2 Client positioning module flow chart
WiFi signal scanning is implemented using the WiFiManager class provided by the Android API. First, it is determined whether WiFi is enabled; secondly, the WiFiManager and WmInf0 objects are obtained, and scanning is started by the methods such as startScan() and getScanResuits(), and the scan result mScanResult is obtained; finally, the data is transmitted to the server for positioning calculation. The Android platform provides users with rich interface display controls. This design uses ListView to display the location location information returned by the server.
2.2 Server-side module design
The server first needs to constantly listen to the specified port. When it listens to the client's request, it creates a new process, which is responsible for processing the client's request. The process is shown in Figure 3. Listening data, if receiving the data, perform CRC check and end the link frame, query the database according to the requested content and perform positioning operation, and finally return the positioning result, and feedback the data to the client interface to display the positioning information.
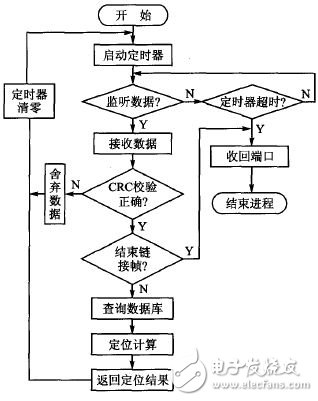
Figure 3 server-side flow chart
3 positioning algorithm design
In indoor or outdoor environments, due to the influence of terrain and obstacles and the blockage of the human body during signal propagation, multipath propagation and multiple-site propagation such as refraction and diffraction of wireless signals will occur, reaching the terminal at different times, resulting in propagation signals. Changes in amplitude, frequency, and phase. It makes the RSS values ​​collected at different times and at different times very uncertain. Even if the RSS size collected by different positioning devices at the same time and at the same time is different, it will affect the accuracy of positioning and the attenuation model of wireless signal propagation. It is difficult to well characterize the mapping between distance and signal strength. Therefore, this paper adopts a location fingerprint-based localization algorithm, and at the same time, proposes an improved localization algorithm to improve the location robustness.
3.1 Location Fingerprint Location Algorithm
The location fingerprint location is based on the signal strength vector received at different locations, and the corresponding location fingerprint database is established. The signal strength stored in real time and the signal vector stored in the database signal space are used to locate according to a certain matching algorithm. The algorithm can reduce the influence of multipath effect to a certain extent and enhance the anti-interference ability. At present, the location fingerprint-based localization algorithm is mainly divided into deterministic and probabilistic types. The former has higher computational efficiency, while the latter has higher positioning accuracy, but the computational complexity is larger. For rapid positioning, a deterministic location fingerprint localization algorithm is adopted. .
The location fingerprint location process is generally implemented in two phases: an offline sampling phase and an online positioning phase. The main purpose of the offline sampling phase is to establish a location fingerprint database, design a reasonable sampling distribution map according to the positioning environment, traverse all the sampling points in the to-be-positioned area, and record the corresponding signal strength, MAC address and position information in the fingerprint database. The accuracy of the data in the database determines the accuracy of the positioning, the more accurate the data, the better the positioning effect. The online positioning phase uses the Android mobile phone to measure the signal strength and physical address of the AP at the point to be located, and then searches the database for data matching the measurement point through the corresponding matching algorithm, thereby estimating the actual location of the user. The location fingerprint location process is shown in Figure 4.
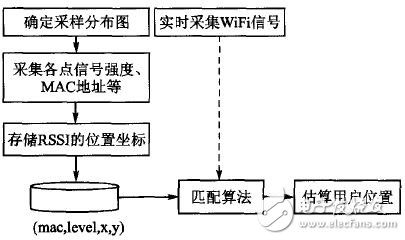
Figure 4 positioning block diagram
3.2 Matching algorithm
The usual matching algorithm has K nearest neighbor matching algorithm (KNN), which can effectively improve the positioning accuracy and mature application. In this paper, the matching algorithm is adopted. The essence of the K-nearest neighbor matching algorithm is to calculate the distance between the RSS vector collected by the point to be measured and the recorded RSS vector in the database. Assuming that there are n APs and m reference points in the area to be tested, the expression of the distance is as follows:
Where q is a positive integer, when q=1, it is called Manhattan distance, q=2, called Euclidean distance; L is the distance of vector in space. In this paper, q=2 is used for calculation. When the position points of n minimum Euclidean distances are obtained, the centroid of n coordinate points is obtained as the position coordinates of the points to be measured.
3.3 Improved location fingerprint localization algorithm
Theoretical research shows that due to the complex indoor environment, the wireless signal will have a certain fluctuation in signal strength due to time changes, random shaking of the human body and the environment. In order to ensure the stability of the signal data itself, the following experiments were carried out in a laboratory environment: data were collected at different times in the same location, and 300 WiFi signals were collected every 1 S in the morning and afternoon. It is found that the wireless signal does not change much with time, and there is basically an error of about 2 dB, which has little effect on the positioning result.
However, during the multiple test process, it is found that the wireless signal strength will appear in a certain position as shown in Figure 5. The majority of the signal strength values ​​remain within a certain range, but there will be jitter data in the middle. The accuracy of offline data and the accuracy of online positioning have a great impact. The method of directly averaging does not characterize the signal characteristics of the location. The collected wireless signal strength values ​​should be smoothed and the effective points selected.
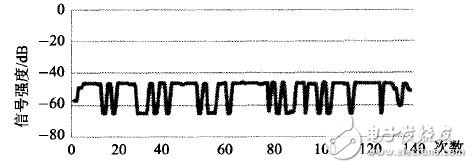
Figure 5 Wireless signal distribution
The following improvements are proposed for the smoothing of wireless signals:
1 Collect all signal groups every 1 S, assuming that the signal strength value of one of the groups is level, and then collect twice at consecutive intervals;
2 If the signal strength values ​​of three consecutive acquisitions are between [1evel - 1, level + 1], insert the data into the database, otherwise discard all the previous signal values ​​and return to step 1;
3 Then calculate the multiple sets of wireless signal strength values ​​obtained in step 2 and store them in the offline database.
After smoothing the graph 5 with the improved scheme, the signal strength value before the improvement is RSS=1.597 1, and the improved RSSI=-46. I47 1. It can be seen that this scheme can remove certain jitter signals and obtain an ideal offline database. This method is not only used in the offline data sampling stage, but also applied to the online positioning stage to collect the current wireless signal strength in real time, which can avoid the uncertainty of single acquisition.
For the influence of device differences on wireless signals, firstly, the WiFi signals are collected 300 times by Huawei's two different models in the same location. The wireless signal distribution is shown in Figure 6. The signal strength of the C8812 mobile phone is maintained at 65-66 dB, and the signal strength of the P6 mobile phone is maintained at 45 dB. The error of different models of mobile phones may cause 2O dB. If the positioning is performed according to this, a large positioning error will occur, so this paper will Adding a wireless signal correction stage before real-time positioning can effectively improve the positioning accuracy.
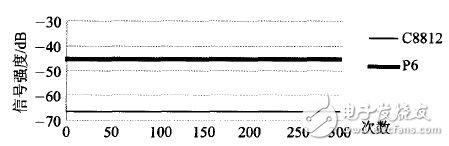
Figure 6 Wireless signal distribution of different mobile phones
To address the impact of device differences on WiFi location, Ekahau proposed an automatic correction method. It analyzes the signal changes of the tracking device in some easily detectable areas, and automatically learns and tracks to establish the corresponding mapping relationship. The disadvantage of this method is that the device is not easy to enter the easy detection area, and it is difficult for the system to obtain sufficient data to establish a mapping relationship. Haeberlen's research shows that there is a linear relationship between the signal strength between the calibration device and the test device. In this paper, after a lot of experiments, statistics are obtained and the relationship between the calibration equipment and the test equipment is derived by the function fitting method. It can be regarded as the linear relationship of y=ax+b, and the parameters a and b will be obtained from the actual data.
4 Experimental results and analysis
The experimental area is 10 m & TImes; 16 m, which is set to a sampling point every 1.5 m, and the AP is distributed around the area as shown in Fig. 7 for the black dot position. Each sampling point is collected 200 times and then smoothed. Into the offline database. In order to compare the accuracy of the positioning results, the following five points are selected as test points: A is located near the exit, B is at the center of the area, and points C, D, and E are located at the boundary of the area.
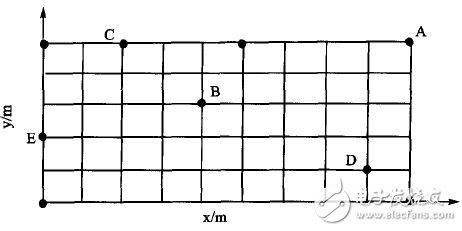
Figure 7 sampling distribution map
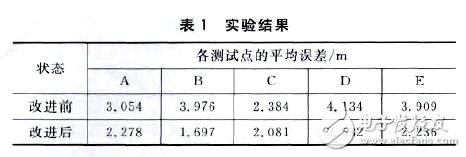
The test was carried out 40 times before and after the improvement, and the analysis of the experimental results is listed in Table 1. The average error of each test point is reduced by the improved algorithm. The point A is located at the exit, which may be affected by other factors, and the positioning effect is not obvious. The points B and D are less affected by the outside world and the positioning effect is better. The positioning accuracy is improved by about 2 m.
Best Tower Speaker,Tower Speakers For Sale,Soundlogic Tower Speaker,Tower Speakers With Mic
Newmax Electronics Co.,LTD , https://www.fspeaker.com