A new indicator for reliability assessment of distribution networks
A new indicator for reliability assessment of distribution networks
Power system reliability is an important measure of the operation of a power system. Traditional power system reliability indicators reflect the availability of power system components or networks, but do not reflect their economic components. This paper proposes a new indicator for the evaluation of power system distribution network - economic reliability, which not only reflects the reliability of the power system, but also reflects the economics of the power system. This is of great significance for improving the economic efficiency of the power system.
Keywords: power system, economy, reliability
A New Index of Reliability EvaluaTIon of Power Systems
Zhang xin-yong, Huang Qun-gu, Ren Zhen
(1. Electrical Power College, South China University of Technology, Guangzhou 510640, China; 2. Zhongshan Power Bureau, Zhongshan 528400, China)
A new index: economic reliability of evaluates reliability of power Systems presented in this paper, not only respond availability of Power Systems but also deals with economic properties of power systems. This is of importance for improving economic results.
Key words: Power Systems; economy; reliability
0 Introduction Power system reliability research has been covered in many literatures [1-3], and the research content is also very extensive: the reliability of high-voltage power networks, the reliability of high-voltage DC transmission, the reliability of high-voltage switchgear, etc. Wait.
Distribution systems are an important part of the power system. The reliability assessment of the distribution system is to evaluate the power supply reliability of the power distribution network or the newly designed power distribution network to determine the reliability of the power distribution network. Through the reliability assessment of the distribution network, the impact of planned power outages and fault power outages on power supply reliability can be determined, thereby determining technical measures to improve power supply reliability and management methods for seeking to improve power supply reliability.
In general, in the case of conventional reliability assessment, a highly reliable distribution network is not necessarily economical, and a highly economical distribution system is not necessarily highly reliable. The distribution network with high "economic reliability" index proposed in this paper has high reliability and economy at the same time.
1 General reliability assessment of distribution network system In the reliability assessment of distribution network system, traditionally, the more commonly used indicators are: failure rate λ and power inspection rate of power transmission and transformation equipment. The failure rate λ is generally expressed in units of “time/year·tai†or “time/year·kmâ€, indicating the number of failures per device per year in a year, or the number of failures per mile per year in a year. . In addition, the following reliability indicators are usually used:
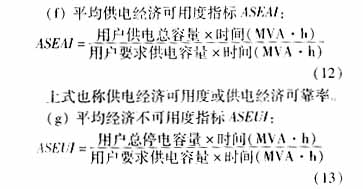
(a) System Average Interruption Frequency Index (SAIFI): 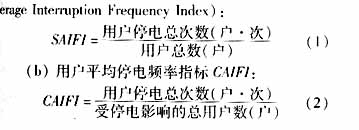
The above formula is also called power supply availability or power supply reliability.
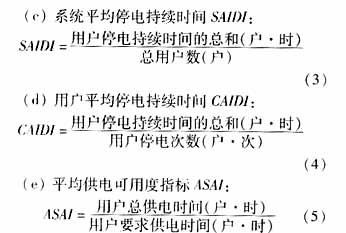
(f) Average unavailability indicator ASUI: ![]()
Complex distribution networks are made up of radial networks and ring networks. Obviously, in terms of reliability, a ring network is superior to a radial network, and a segment or branch switch is superior to a network without a switch. This is mainly determined according to the range of power outages in the event of a network failure, that is, based on the number of households x hours of power outages.
However, using the indicator “number of households × hours / year†or “number of times / km†or “number of times / year†to carry out the reliability assessment of the distribution system, only reflecting the scope of a power outage, the economic loss caused by the power failure Can't reflect it. A large user (large capacity) and a small user (very small capacity) have the same contribution to the indicator "number of households × hours / year" or "number / km" during the same power outage time. However, it is clear that the economic losses of the two are very different. The following "economic reliability" indicators are mainly to assess the reliability of distribution network systems from an economic perspective.
2 Distribution network system economic reliability indicators In the power system, what is directly related to the economy is the amount of power supply. When the system fails, the power is also affected. In the event of a system failure, the first is to reduce the power outage time, the second is to reduce the power outage range, that is, the number of households with power outages, and the third is (and more importantly) to minimize the amount of power lost due to power outages. That is to say, we must not only consider "number of households × hours", but also consider "kilowatts x hours" or "megavolts x hours". Here, the "megavolt-ampere (hours) index highlights the weight of large users and reduces the status of small users, so that the reliability index of the distribution network can not only reflect the scope of the power outage, but also reflect the economic loss during power outage. How big.
According to the above concept, when conducting reliability assessment of distribution network system, the following economic reliability indicators are proposed as follows:
(a) Failure rate indicator λ: 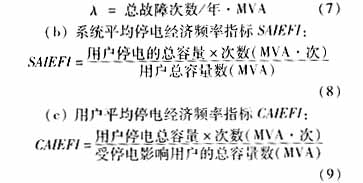
The following is an assessment of the reliability of a distribution network system in an urban area using economic reliability indicators.
3 Application examples For the sake of clarity, the examples here are limited to radial distribution networks, and ring distribution networks can be analyzed as well.
Set up an independent 10 kV medium voltage distribution network system under the jurisdiction of a certain city, with a total of 620 households, a total installed capacity of 359 MVA, a total length of 245.53 km, and a line of 10 kV lines. The statistics of the blackout data are shown in the table. 1 is shown.
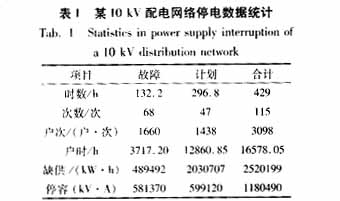
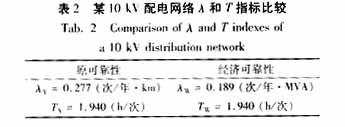
In the following analysis, the original reliability index is indicated by the subscript Y, indicating that the economic reliability index is indicated by the subscript W. The failure rate λ of the system and the average time T of each power failure are shown in Table 2.
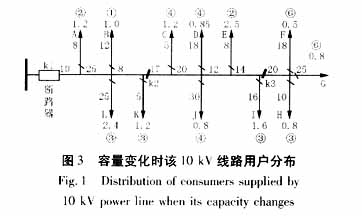
Take a 10kV line in the city as an example (as shown in Figure 1), perform reliability assessments, and evaluate them separately using traditional reliability and economic reliability.
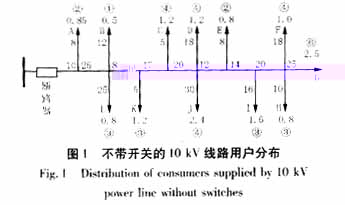
For convenience, all the spur lines are equivalent to a segment with an arrow, and all the capacity on the branch line is equivalent to its total capacity. The capital letters A, B, C, etc. in Fig. 1 are user numbers, and the arrows point to the capacity (MVA) of all user users of the branch line. The number next to the line segment is the length of the line segment (km), and the number in the circle is The number of all users on this branch.
When the substation is stopped once, it is 8h, so all 39 users on the network in Figure 1 are affected; since there is no switch installed on the line, when there is a permanent failure at any point on the line, it will result in Figure 1. The power failure of the whole line, the power outage time is the troubleshooting time, set to 4h. According to Table 1, it can be calculated when the substation is completely stopped, the number of hours xh1 and hW1 of the network, the number of hours xh2 and hW2 of the planned power outage, and the number of hours of the power failure × hY3 and hW3, considering the full stop, planned power outage The ASAI of the power outage and the ASAIF when only the power outage occurred, the results are shown in Table 3 below.
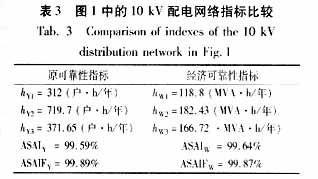
It can be seen from Table 3 that the original reliability and economic reliability indicators of the system of Figure 1 are close.
When the segment switch and the branch switch are installed on the line, as shown in Figure 2, the original reliability and economic reliability indicators are calculated respectively. The results are shown in Table 4.

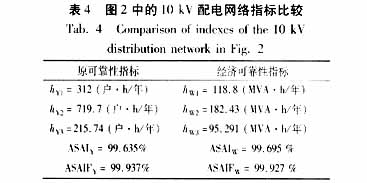
It can be seen from Table 2 that in the case of a segmented switch and a branch switch, the original power supply availability of the network shown in Fig. 2 is higher, and the economic power supply availability is lower.
The network structure in Figure 2 and the number and number of users on each branch line are the same, except that the capacity of the part of the branch changes, which is equivalent to the exchange of some large users and small users, as shown in Figure 3.
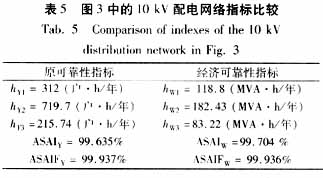
Recalculating the reliability indicators of the network structure of Figure 3, it is found that the original reliability index of the network after the change is unchanged, and the economic reliability index changes, and the economic availability increases. As shown in Table 5.
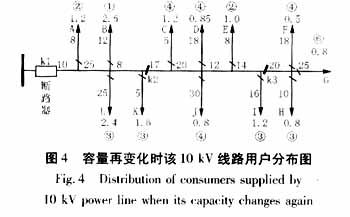
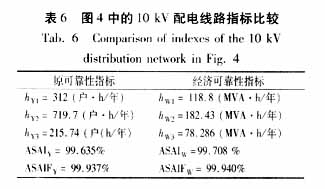
Once again, the installed capacity of the network part of Figure 2 is re-converted, and the corresponding reliability index is calculated. The results are shown in Figure 4 and Table 6.
Comparing Tables 3 and 4, it can be seen that when the network is equipped with segmentation and branch switches, both the original reliability index and the economic reliability index are improved, that is, the power supply reliability rates of both methods, ASAI and ASAIF, are improved. It can be seen that the segmentation and branch switches play an important role in improving the reliability of the distribution network.
Comparing Table 4, Table 5, and Table 6, it can be seen that the network structure and the number of users are the same, only when the user's installed capacity changes on the branch line, the original reliability rates ASAI and ASAIF are unchanged, that is, on the network, the connection Whether it is a large user or a small user, the reliability rates of ASAI and ASAIF are unchanged. However, the economic reliability has changed. The closer a large user is to the power end of the line, the higher the economic reliability.
Compare the MVA of Table 4, Table 5 and Table 6 for power failure (the number of hours/year is known, the network of Figure 2 is 95.291 MVA (hour/year, the network of Figure 3 is 83.22 MVA (hour/year, the network of Figure 4 is 78.286 MVA ( Hour/year. From the network of Figure 2 to the network of Figure 4, the number of hours of power outages decreased by 17.8%, and the economic loss was reduced by 17.8%. If the distribution network of the entire urban area was modified during medium and low voltage distribution, Being able to balance economics at the same time not only improves reliability, but also has considerable economic benefits.
4 Conclusions This paper proposes a new indicator for the evaluation of power system distribution networks—economic reliability, which not only reflects the reliability of the power system, but also reflects the economics of the power system. The improvement of this indicator is of great significance for improving the reliability and economy of power system distribution network operation.
Dongyuan Syscooling Technology Co., Ltd. , http://www.syscooling.com